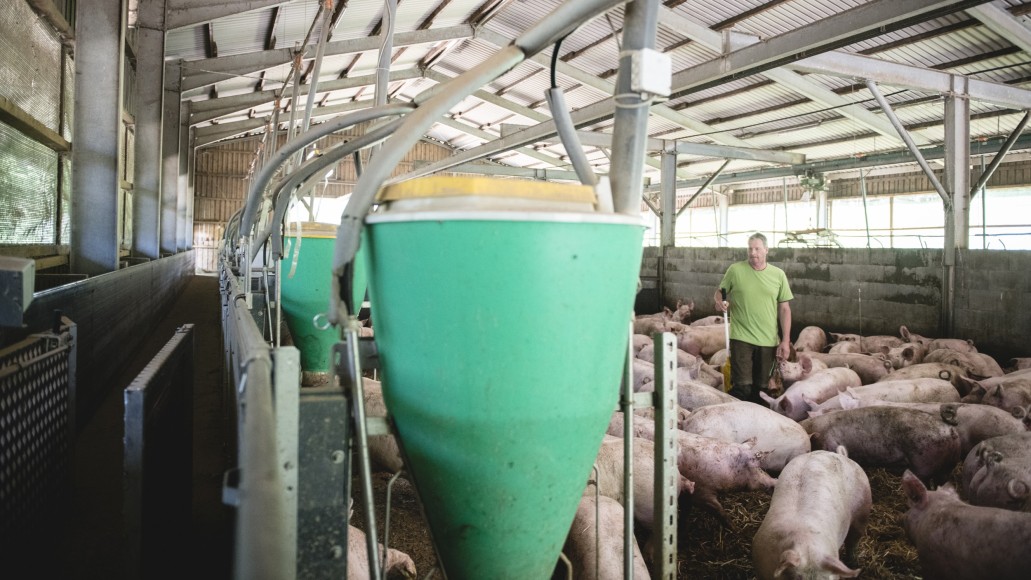
Feeding Guide

How does the cow digest food? Get an overview of the essential factors of dairy cattle feeding in our feeding guide.

  Ration     Ration     Milk     Milk     Mouth and     Esophagus     Mouth and     Esophagus     Leaves and     Abomasum     Leaves and     Abomasum     Rumen and     Reticulum     Rumen and     Reticulum     small intestine     small intestine     Colon     Colon     Dung     Dung  

No area selected

By clicking on one of the seven specified fields on the cow, you will receive detailed information on different feeding parameters and digestive processes.

Parameters Grass silage 1. Cut Maize silage
Dry mass (DM) in % 30-40 30-37
Raw ash % in DM <10 <4
Raw protein (XP) % in DM <17 <9
Raw fibre % in DM 22-25 17-20
NDF % in DM 40-48 35-40
ADF % in DM 24-28 21-25
ELOS % of the DM >68 >67
Gas formation ml/200mg TM >50 n.a.
Structural value (SW) 2.6-2.9 1.5-1.7
Starch % in DM -- >30
Sugar % in DM 3-8 --
ME MJ/kg DM >10.6 >11
NEL MJ /kg DM >6.4 >6.6
nXP g/kg DM >135 >132
RNB g/kg DM <+6 -8 to -9
Source: LUFA Nord West and LUFA NRW

Palatability of the feed components:

Only the best quality feed should be used. Coarse and juice feed must be flawless both from an energetic and hygienic point of view.
Cows have a pronounced sense of smell and taste and are very demanding in terms of feed quality.

Dry mass of the ration at the trough:

TM contents between 35% and 45% in the presented ration are the choice to eat and on average achieve the highest DM intake in the cow.

Dry rations (>45% DM) Wet rations (<35% DM)
Tendency for segregation
  • Cows eat selectively


Contain a lot of water
  • Usually results in lower overall DM uptake, as animals absorb a lot of water
  • Structural effectiveness of a wet diet is worse

Physical structure of the ration

  • Presence of sufficiently long particles → serve to form the fibre mat in the rumen
  • The fibre mat is a prerequisite for physiological rumen function


The basic requirements are:

  • Mixing
  • Contraction
  • Rumination


A good check of structure is provided by a simple test:

  • Ration "squeaks" when squeezing in the hand
  • After firm compression, food swells in the hand again
  • There are no particles that are too long and selectable in the ration (straw, grass silage)
  • Homogeneous mixture of the feed
  • Chop length of 4-6 mm for maize and up to 4 cm for grass is enough for stable fibre mat
  • Reference number: Particles larger than half the mouth width are selectable!

(Source: DLG-Information 1/2001)

(Source: DLG-Information 1/2001)

The use of a feed shaker box provides accurate information about mixing accuracy and selection as well as the particle size distribution in the ration.

The shaker as a 3-part sieve box system

The shaker box consists of a three-part sieve box system which divides the sieved feed through the various sieve hole sizes into 3 fractions.

Applications:

  • Determination of particle sizes for structure evaluation
  • Evaluation of leftover food
  • Checking the mixing accuracy


Application:
Approximately 300g of original substance (at least 200, max 400g) are placed in the upper sieve of the assembled sieve box.
On a smooth surface, the sieve box should then be shaken vigorously according to the following diagram:
Turn each side 5 times, then rotate box one quarter clockwise, i.e. in one pass 40 shaking movements are necessary.

Ration assessment:

Subsequently, the weights are determined on a scale. The following table lists recommendations for fractional proportions in a TMR:

Sieve fraction and particle size Recommended proportions by weight in a TMR
Upper sieve (> 1.9 cm) At least. 6-10%
Middle sieve (< 1.9 cm → 0.8 cm) 30-50%
Bottom sieve (< 0.8 cm) 40-max. 60%

To evaluate partial-mixed rations, in which the cows can also call up concentrated feed via a transponder station, the concentrate must be assigned to the fraction in the lower sieve by weight.

Sampling leftover food with the shaker box gives information about whether the animals eat the ration equally If leftover food is significantly different in composition from the freshly prepared ration, then the animals select the ration and do not eat equally!

Sequence of forage selection (e.g. concentrate components in a dry mix ration) results in structural deficiency and acidosis, although there are computationally sufficient structural components in the ration.

The recommended weight percentages are approximate. Shortfalls of 6% in the upper sieve, as well as exceedances of 60% in the lower sieve are considered criticalin terms of structural supply .

Dairy cows have a high need for feed structure and at the same time for energy density. Depending on weight, lactation status and milk performance level, the ration must be adapted to the respective performance level in the best possible way. The most important demand figures are presented below.

Energy requirements:

The energy requirement of a cow is given in MJ NEL (Megajoule net energy lactation). This energy requirement is divided into the maintenance requirement and the power requirement.

Maintenance requirement Power requirement
The maintenance requirement depends on an animal’s biomass and includes the nutrients needed by a full-grown, non-lactating and non-pregnant cow to maintain its metabolic processes
The additional power requirement results from the nutrient consumption for milk production, the energy demand and further growth of foetus and tissue during pregnancy


Maintenance requirement of dairy cows of different biomasses

The following table shows the maintenance requirement for dairy cows of different biomasses.

Biomass (kg) Maintenance requirement (MJ NEL/day)
500 31.0
550 33.3
600 35.5
650 37.7
700 39.9
750 42.0
800 44.1

Source: Society for Nutritional Physiology, 2001

Energy requirement per kg of milk depending on the fat content

The energy requirement for milk production varies depending on the fat content of the milk. The demand for MJ NEL per kg milk yield is shown in the table below.

Fat content of the milk Requirement for NEL (MJ / kg milk)
3.0 2.9
3.5 3.1
4.0 3.3
4.5 3.5
5.0 3.6

Source: Society for Nutritional Physiology, 2001

Protein requirement

  • The raw protein supply via the feed says little about the protein quality in the small intestine due to the microbial digestion in the rumen. Both the microorganisms in the forestomach and the cow itself at the small intestine must be optimally supplied with protein. Evaluation of the protein in the dairy cow is based on the usable crude protein in the small intestine, a term known as nXP
  • nXP consists of undegraded feed protein (UDP) and microbial protein. It is calculated using UDP and energy content for each feed
  • The following table contains guideline values for the supply of nXP, divided into maintenance and energy requirements, as a function of mass and milk yield

Example:

For example, a 650 kg cow with a milk yield of 30 kg of milk and a milk protein content of 3.40% has a requirement of 3000 g nXP per day.

Reference values for the supply of usable crude protein

Conservation nXP
500 kg LM 390 g/d
550 kg LM 410 g/d
600 kg LM 430 g/d
650 kg LM 450 g/d
700 kg LM 470 g/d
750 kg LM 490 g/d
800 kg LM 510 g/d
Milk production
Milk with 3.2% protein 81 g/kg milk
Milk with 3.4% protein 85 g/kg milk
Milk with 3.6% protein 89 g/kg milk

Source: Society for Nutritional Physiology, 2001

Demand values of the ration in the different lactation sections (annual milk yield: 8,000 - 10,000 kg)


  Early lactation Medium lactation Late lactation Dry cows
Desired feed intake
kg TM per day
min. 21 >21 18-21 12-15
Energy content
MJ NEL/kg T
7.0-7.3 6.7-7.0 6.5-6.7 5.3-5.7
Protein content
g nXP per kg TM
165-175 145 - 165 140-145 100-125
Starch and sugar
g per kg of TM
150 – max. 250 110 - max. 225 75-225 n.a.
Stable starch
g per kg of TM
20-50 20 - 50 max. 25 n.a.
Structure value min. 1.1–1.15
min. 1.1 min. 1.0 min. 2.0
Crude fat
g per kg of TM
Max. 45 Max. 45 Max. 45 max. 40
Crude fibre
g per kg of TM
min. 150-180 min. 150 - 190 min. 150 min. 260
RNB
g per kg of TM
0–1 0–1 0–1 0

Source: Society for Nutritional Physiology 2001

In the feeding phase (from 3 weeks before the calving date), the energy concentration of the ration must be raised again, as the feed intake decreases with a growing foetus!

The rumen microbes are recommended to “get used” to the feed components of the lactating ration; feeding with concentrated feed components.

  • Energy concentration of the ration on the trough has a great influence on the amount of food ingested
  • The higher the energy density, the higher the amount of food consumed
  • The table below shows the required dry matter intake to meet the energy needs of a dairy cow of 650 kg biomass, with different energy concentrations in the feed, depending on the milk yield

Example of different milk yields with the same feed intake:

Cow eats almost the same amount of food in both cases, but: difference of 10 kg milk yield between high and low energy density!

MJ NEL7kg TM
  5.2 5.6 6.0 6.4 6.8 7.2 7.6
10 13.6 12.6 11.8 11.0 - - -
15 - 15.6 14.5 13.6 12.8 - -
20 - 18.6 17.3 16.2 15.2 14.7 -
25 - - 20.0 18.8 17.7 16.7 15.8
30 - - 22.8 21.4 20.1 19.0 18.0
35 - - - 23.9 22.5 21.3 20.2
40 - - - 26.5 25,0 23.6 22.3
45 - - - - 27.4 25.9 24.5
50 - - - - 29.8 28.2 26.7

Source: Society for Nutritional Physiology, 2001

The feed intake capacity depends on:

  • Feed quality
  • Performance
  • Animal material
  • Environmental influences
  • Management at the trough

  • Even within a single farm, strong fluctuations in feed intake are observed
  • Determining the average amount of feed consumed by the herd is therefore one of the most important controlling instruments in dairy cattle husbandry!
  • The basis for the ration calculation must be analysis results of the feed actually used
  • Ideally, analyses should be available before the start of the crop to calculate ration planning and composition.
  • Carry out slow/sliding feed changes (blending) to ensure adaptation of the rumen microbes.
  • Use only hygienic and clean feed. Warmed and mould-laden areas cause health problems.
  • Water supply is important:
  • Check water quality and flow and clean troughs daily. Water is the cheapest feed. If there are deficiencies in the water supply, even the best food is no use!

Detailed presentation of carbohydrates in the extended Weender analysis:

NFC = Non fibre carbohydrates and

NDF = neutral detergents fibre

NDF represents the complete fibre fraction of a plant

ADF = acidic detergents fibre

ADL = lignin

NDF and ADF still contain silicates and silicic acid

After ashing, NDF org and ADF org are determined

  • Re-chewing causes intensive shredding of the feed in the mouth → excretion of gaseous metabolites (CO2 and CH4) via the mouth
  • Saliva quantity 100-200 l per day with dairy cow; pH-value in saliva 8.2-8.4
  • Sodium bicarbonate in saliva as buffer substance for the rumen; stabilises the pH-value by repeating the process
  • About 30-70 minutes after ingestion, the contents of the rumen are transported back into the oral cavity in several periods, chewed and swallowed again
  • Rule of thumb: More than 60% of recumbent animals should re-chew
  • The number of chewing strokes per bite provides information about the structural supply of the animal. On average, at least 55 chewing strokes per bite in the lactating herd is ideal. If fewer chewing strokes are counted, this is an indication of a lack of feed structure and limited re-chewing
    Consequence: acidosis
  • With > 70 chewing strokes per bite, there is too little energy in the rumen of the lactating cow in relation to the structure
  • 70 chewing strokes is ideal for dry animals
  • in pasture grazing:
    Rule of thumb: 1 kg feed DM intake per hour with active grazing possible

Observe feeding behaviour of the cows!
  • Cows are selection artists. Ration ingredients that exceed half the mouth width (e.g. long grass silage, long straw, potatoes ...) may be selected
  • Any selection in a TMR is negative, as it may lead to disturbances in the rumen flora

How do I recognise selective eating behaviour?
  • Animals push the food back and forth before they eat, because concentrated feed particles trickle down through a dry ration
  • Holes are visible in the presented ration
  • Food residues differ visually and in the composition of the particle size significantly from the freshly mixed ration (check with shaking box)

Tip: A conspicuous, outstretched mouth during feed intake may be an indication of the lack of structure of the ration. The cow holds its mouth in a horizontal position, so that fine parts do not fall out of the mouth when chewing at the trough

  • The reticulum is adjacent to the oesophagus in the rumen. It is able to contract, transporting the feed back into the oral cavity for re-chewing and vice versa (chewed particles from the oral cavity back into the rumen).
  • The function of the reticulum is mainly the "sifting" of food and transmission of fine particles in the omasum. Digestive processes do not take place here directly.
  • The rumen has a capacity of 100l to 180l and forms a functional unit with the network stomach (Psalter).
  • About 70% of bovine digestion takes place in the rumen
  • Digestion works with the help of various microorganisms (bacteria, protozoa and fungi)
  • Metabolites of digestion in the rumen include:
    • Short chain FS (propionate, acetate and butyrate)
    • CO2 and methane
    • Amino acids and NH3
  • The optimum pH-value in the rumen is 6.5
  • High-starch feeding leads to high levels of propionate and lactate and causes an increased lowering of the pH-value
  • pH-values < 6 lead to rumen acidosis (see the side note on How to recognise rumen acidosis)

  • Rumen acidosis is currently a widespread metabolic disease ("dairy cow civilisation disease"), which results from the demand for a very high energy density in the feed and at the same time adapted structural supply of the high-performance cow
  • Lack of structure supply leads to lack of stratification in the rumen and consequently to a reduced number of rumen contractions. The cow does not chew enough.
  • In the lower part of the rumen are the easily soluble feed components and the rumen fluid (liquid phase)
  • Above it floats what is known as the "fibre mat", which mainly consists of roughage and triggers the re-chewing reflex in the rumen (solid phase)
  • In the upper part of the rumen are the fermentation gases from the microbial conversion (gaseous phase)
  • Lack of ruminating in case of structural deficiency leads to hyperacidity in the rumen due to lack of neutralisation by saliva (sodium bicarbonate)

Digestion of carbohydrates in the rumen:

  • In the rumen, carbohydrates are broken down into short-chain fatty acids (FFAs), methane (CH4) and carbon dioxide (CO2)
  • CH4 and CO2 are released via the mouth (eruction)
  • FFAs are absorbed via the rumen mucosa:
  • Degradation of cellulose produces primarily acetate (acetic acid)
  • Degradation of starch produces propionate and butyrate (propionic and butyric acid)
  • In addition to its nutritional function, cellulose as a structural substance also has an important physical function in the rumen as a source of feed
  • Structure is crucial for rumen motor function, ruminating and the resulting salivary production to regulate rumen pH-value

Digestion of protein in the rumen:
  • Protein is broken down by microbes into mainly amino acids and short chain fatty acids (FFAs)
  • FFS are absorbed and AS are used to build microbial protein
  • Microbes use the ammonia (NH3) liberated from the feed protein degradation again to build up their own microbial protein
  • Feed protein that is hard to digest or undigestible (UDP) continues undigested until it reaches the small intestine
  • Nitrogen is recycled in ruminants via the ruminohepatic circulation and is not lost; i.e. N is returned to the rumen via the liver and saliva
  • This cycle can deliver up to 50% of the N needed
  • Too much N thus always means a greater burden on rumen and liver metabolism for a ruminant
  • 10-25 mg NH3/100 is ideal in rumen fluid
  • If there is an oversupply of soluble protein in combination with starch deficiency, values of 40 mg/100 ml can also be reached
  • Consequence: Rumen alkalosis (pH-values> 7) associated with depression in feed intake (rather rare)
  • Protein supply to the cow is covered by microbial protein and UDP
  • Microbial protein sufficient for maintenance needs including 12 to 15 kg milk yield
  • Content of usable crude protein in the small intestine (nXP) in the feed becomes more important with increasing performances, in order to cover the needs of the animal!

Remember: Microbial protein + undegradable feed protein (UDP) = useful crude protein in the small intestine (nXP)

Digestion of fat in the rumen:

  • Microbes modify the fatty acid pattern
  • Triglycerides and phospholipids are broken down by lipolysis into glycerol and fatty acids
  • Glycerol is further processed in metabolism of carbohydrates
  • Fatty acids are needed only to a small extent by microbes and are therefore almost completely hydrogenated and further digested in the small intestine
  • Ruminants are physiologically not designed for fat digestion!
  • The fat content of a daily ration should not exceed 4-5%, as otherwise there will be digestion problems in the rumen
  • Fats protected in the rumen (e.g. thermally treated) pass through the rumen and are digested in the small intestine
  • Even when using rumen-proof products, observe the limit of 5% fat content in the daily ration!

Important: Monitoring rumination (frequency, chewing strokes)

Parameters to be checked Target value Danger of acidosis
Count repeat chewing strokes per bite (2-3 reps per cow) 55-60 per bite in lactating animals < 50 chewing strokes per bite
Severe foaming when ruminating
Check rumen filling A rumen score of 3-4 is ideal in lactating cows For rumen scores of 1 and 2*; here, what is known as the "warning triangle" is formed (see the side note on Rumen filling)
Dropping consistency and fibre content Depending on the feeding, aim for a score of 2-3 Thin, diarrhoea-like excrement (score 1)*
Body Condition (Body Condition Score)
Coat condition
Depending on performance and overall constitution, BCS scores of 2.5-3.25 in lactating cows Weak BCS * (<2.5)
and dull, shaggy fur
Milk ingredients in the tank and single animal Depending on the level of performance; fat contents > 3.6% in the tank Fat contents < 3.6% in the tank; herds with a high genetic fat content as low as <3.8% are to be rated as critical; for individual animal evaluation, see the side note on Assessing milk ingredients
Hoof health/Lame animals As few lame animals as possible! Sudden onset of severe lameness; soft horn; haemorrhages in the sole ... (see the side note on Recognising deer)
pH-value measurement in the urine/rumen Urine: > 8.0 pH value
Rumen: > 6.0 pH value
If the target values in the urine or rumen are below the stated target values

* will be explained in more detail below

Rumen score 1:

Very deep sunken paralumbar fossa; animal has not eaten for a long time; paralumbar fossa appears rectangular. The skin below the hips runs vertically downwards and lies beneath the transverse appendices. The paralumbar fossa is more than one hand width behind the ribcage. A clear indication that the animal is not OK!

Rumen score 2:

Deep sunken paralumbar fossa; feed intake insufficient; paralumbar fossa appears as a triangle ("warning triangle") and is one hand width behind the ribcage. Skin is under the transverse processes. Often seen in animals that are about calve; in lactating animals, it is a sign of lack of feed intake

Rumen score 3:

Paralumbar fossa is only slightly visible behind the rib cage. The skin over the transverse processes runs one hand width vertically and then bulges outward. Targeted rumen score for lactating cows in the first half of lactation with good feed intake and optimum feed pass rate

Rumen score 4:

The paralumbar fossa is not visible. The skin over the transverse processes bulges directly to the outside. Ideal rumen score for old milking cows and dry cows.

Rumen score 5:

No paralumbar fossa and no transverse processes visible; the abdominal skin is stretched round and the rib cage merges seamlessly into the flank. This is how the rumen score should be for dry cows. Sign of good feed intake

The table represents the optimal course of a BCS curve

  • At the time of calving, scores between 3.25 and 3.75 are sought
  • In this condition, the cow has the body reserves it needs for high performance in the first third of lactation
  • BCS scores > 3.75 are already considered to be over-conditioned/fatigued and are always associated with heavy weights, metabolic disorders and already reduced food intake in the dry period (see the side note on Ketosis)
  • Healthy cows do not lose more than 0.75 to max. 1 condition point in the first third of their lactation
  • BCS scores <2.5 in the high performance phase are considered critical
  • in the second half of lactation, a steady increase in BCS of about + 1 point is desired in order to regain reserves for the next calving

Reasons for the emergence of laminitis:

  • Most important reason: Mistakes in feeding → feeding-related laminitis; entire hoof is affected
  • In addition to this feeding-related occurrence, there are other reasons for the emergence of laminitis:
    • Contamination laminitis
    • Postparturient laminitis
    • Stress laminitis (mostly only outside rear hoof affected)


What happens with laminitis?

  • Lack of structure in the rumen or too much concentrated feed lead to acidosis
  • Low pH-value leads to death of microbes in the rumen
  • Release of endotoxins and histamine causes increase in blood viscosity
  • Higher viscosity of the blood leads to a lack of blood flow to the small capillaries in the dermis of the hoofs
    Consequence: Dying of the cells in the dermis
  • Nutrient supply and thus impaired physiological function
  • In the acute case: Lowering the pedal bone = severe pain; strong lameness
  • Inflammatory processes and haemorrhages
  • Emergence of a double sole

Laminitis of the hoof before cutting; swelling of the
lower foot and double sole can be seen

Source: top agrar 2010

Haemorrhages can be identified on this cross section of a hoof
and an ulcer is clearly visible in the sole

Source: top agrar 2010

Control points to avoid laminitis:

  • Check structure supply and feed intake; especially recently calved animals
  • Laminitis is usually a secondary disease of acidosis
  • Therefore, all control points that have already been mentioned in acidosis are considered here (see Acidosis)

Additional checkpoints:

  • Check mineral supply; e.g. lack of zinc or biotin leads to reduced quality of the hoof horn
  • Discard contaminated feed (mould, yeasts)! Released toxins can trigger laminitis
  • Avoid protein oversupply = metabolic burden; urea values between 200 - 250 ppm in the milk
  • Optimize housing conditions (cubicles and walkways) to prevent stress laminitis, because cows should be comfortable to promote chewing and thus the milk yield
  • Consistent and regular hoof care!
    At least 2-3 times a year for physiological functioning is necessary

Profile view of a hoof with laminitis; haemorrhage
and inflammatory processes (pus formation) recognizable

Source photo: P. Heimberg; TGD LK NRW

Late effects of hoof laminitis

  • Haemorrhages in the sole at the hoof cut indicate "acute" state of the laminitis was about 6-8 weeks ago!
  • Double sole as a result of lack of blood circulation
  • Permanent deformations of the hooves (see picture)
  • Longer term decreased horn quality
  • Defects on the white line (white line disease), caused by the pedal bone reduction
  • Thus increased risk of sole ulcers and hollow wall
  • Increased hoof care effort (correction cut recommended approx. every 3 months)

Deformed hoof growth after laminitis; "beak claw" is recognizable

Source of photos: P. Heimberg; TGD LK NRW

 "Ketosis-affected cow with right abomasal displacement"

"Ketosis-affected cow with right abomasal displacement"

General:

  • In addition to acidosis, ketosis is the most common metabolic disease of the dairy cow
  • Feeding and keeping in the last third of lactation and in the dry period have a major impact on the frequency of this disease
  • Ketosis is always the result of a negative energy balance
  • Causes are diverse!
  • Distinction between primary and secondary ketosis
  • Secondary ketosis is the result of a previous illness (for example, milk fever, lameness, difficult calving)
  • Ketosis usually occurs in the first 4-6 weeks after calving (phase of highest energy deficit)


Reasons for the appearance of ketosis:

  • Very high output at the start of lactation (unavoidable negative energy balance)
  • Feeding not adjusted in late lactation and dry period/intercalving periods too long = animals too fat for calving!
  • Physiologically weaker feed intake up to approx. 80th lactation day
  • Pre-existing conditions (lameness, milk fever)
  • Poor feed quality (leads to reduced feed intake)
  • Butyric acid silage can exacerbate ketosis symptoms
  • Lack of exercise

What happens to metabolism when there is ketosis:

  • Long-term feed intake that is too low creates energy/glucose deficiency in metabolism
  • Fat reserves of the cow are used for energy supply
  • If there is ketosis, fat reserves are excessively reduced
  • Released fatty acids are converted to glucose in the liver with limited capacity (consequence = fatty liver)
  • The degradation of fats in the liver releases ketone bodies, which can be detected in the blood, urine and milk
  • Capacity of the liver for the breakdown of ketone bodies is limited
  • to the ketone bodies
    • Acetone
    • Acetoacetate
    • ß-hydroxybutyric acid
  • Subclinical ketosis often goes undetected, as there are no other signs of the disease besides elevated levels of ketone bodies
  • High levels of ketone bodies in the cow lead to the following listed disease symptoms

Significant signs of disease for ketosis:
  • Lack of appetite
  • Empty rumen (score <2)
  • Strong milk yield decline
  • Apathy
  • Sweetish smell of ketone bodies
  • Noticeable weight loss (> 1 BCS score) over a short period
  • Solid, darker excrement
  • Wide fat:protein ratio in milk with greatly increased fat content
  • Increased ketone body content in urine, milk, blood; measurable with keto test strips or blood glucose meters

Ketosis prophylaxis:
  • Avoiding obesity by appropriate feeding in the late lactation and dry phase
  • Early drying with old milking cows
  • Good food qualities
  • Good feed management
  • High total feed intake before and after calving
  • High energy concentration in ration for freshly lactating livestock (target: > 7.0 MJ NEL/kg TM)
  • Ensuring the need for nXP in high-performing animals (165-170g/kg TM)
  • Overall good herd health (hooves, udders, digestion ...)
  • Individual animal prophylaxis in fat, endangered animals by e.g. administration of propylene glycol from 14 days before calving to 14 days after calving (150-250 ml/animal and day)
  • After calving, check metabolism with ketosis test

Treatment of ketosis:
  • Determine severity of ketosis using the ketosis test
  • Discuss treatment with farm veterinarian
  • Glucose infusion (short-term improvement)
  • Administration of glucoplastic substances, e.g. propylene glycol (daily 250g/animal and day in the mouth)
  • Possible administration of glucocorticoids (stimulation of glucose metabolism and appetite)
  • Possibility to offer exercise

Limits for ketosis in the blood test:
  • Measurement of β-hydroxybutyric acid
  • Normal values: Before birth: <0.6 mmol/l after birth: <1.0 mmol/l
  • subclinical ketosis: 1.4-3.0 mmol/l
  • acute ketosis: > 3.0 mmol/l

Omasum:

Source: bauernhof.net

Source: bauernhof.net

  • food gets into the omasum (last forestomach) via the reticulum
  • The main task of the omasum is the absorption of water, nutrients and sodium bicarbonate (NaHCO3).
  • Microbial digestion takes place to a lesser extent in the omasum

Abomasum:

  • Digestion of proteins takes place in the abomasum; rumen microbial protein and undegraded feed protein (UDP)
  • The capacity of the abomasum is proportionally small
  • Subordinate importance for digestion
  • Abomasum is equipped with many gland cells in which hydrochloric acid and pepsin (enzyme for protein digestion) are produced
  • Very acidic environment; pH-value 2.0 – 3.5 due to hydrochloric acid secretion; acidic environment important for the activation of protein-digesting enzymes (pepsin)
  • Low pH-value kills germs
  • Mucus build up by the gastric mucosa prevents self-digestion of the abomasum
  • Feeding-related abomasal displacement occurs if there is poor feed intake and/or if feed structure is poor. If this occurs with increasing frequency in the herd, the supply of structure should urgently be controlled.
  • A prerequisite for a physiological digestion in the abomasum is optimal rumen function!

  • The first section of the small intestine still has an acidic environment
  • Then neutralisation of the porridge by pancreatic and intestinal secretions as well as bile
  • Digestion of the pre-fermented substrate
  • The enzymes lipase and amylase are responsible for fat and starch digestion
  • Enzyme activity is low compared to monogastric activity, which means that the ability to digest fat and starch in the small intestine is limited in ruminants
  • Even in the small intestine: optimal digestion can only take place if the digestion in the forestomachs is functioning
  • Excessive protein infiltration through protein-rich feeding (grass-fed, young pasture grass, too much protein concentrate) means that the protein quantities cannot be physiologically digested
  • Consequence: Diarrhoea, small bowel colic or appendix dilatations
  • Urea value of milk is a safe tool to check for oversupply or undersupply of protein (see milk quantities and ingredients)
  • Important: The amount of rumen-stable starch that is available in the small intestine is limited in cows and may be at most 1.5 kg, otherwise there will also be abnormal fermentation and diarrhoea due to undigested starch

  • Absorption of H2O
  • High levels of germs in the colon
  • Digestion of undigested starch and proteins on a small scale
  • Degradation to acetate, propionate and butyrate as in the rumen
  • Microbial protein cannot be used anymore
  • Protein degradation to urea
  • Fat digestion in the colon is insignificant
  • High levels of structure in the feed cause the proportion of organic matter in the small and large intestine to be higher
  • This organic substance has a higher water and sodium content and thus a better buffering capacity
  • Fibre-rich, hard-to-digest substrate in the large intestine prevents fermentation and stabilises the faeces consistency (solid faeces)

Milk quantities and milk ingredients give the best conclusions about the feeding

  • Three groups should be distinguished for the test:
    • Fresh milking in the first third of the lactation (0-100 milking days)
    • Medium lactation in the second third of the lactation (100-200 milking days)
    • Late lactating/old milkers in the last third of lactation (> 200 milk days)

  • Entry performances The animals reveal much about the state of health and feeding during the dry period
  • Heifers should average 27-30 kg milk per day in the first Give one third of the lactation
  • Animals that have calved more than once should be 35 kg to > 40kg of milk per day in the first Give one third of the lactation
  • If an animals are in good health and feeding is appropriate, the milking capacity of the herd should be stable at > 80%; the milk yield decrease compared to the previous month's MLP should not exceed 80% of the herd's max. 5 kg of milk per animal
  • On average, the milk yield decrease of the herd between the individual lactation thirds should not exceed 5-6 kg
  • at greater milk yield declines in the herd, in addition to monitoring health, the key should above all be directed towards the feeding !
    • Feed quality and composition, energy density, feed intake control

  • depend on genetics and feeding
  • An important criterion in a herd and for each animal is the fat: protein ratio
  • Target fat: protein = 1.1: 1 to max. 1.4: 1
  • Ratio <1.1: 1 is at a level of <3.3% Note on acidosis
  • A ratio > 1.4:1 when fat content is high and combined with low protein levels (<3.2%) is a sign of severe body fat loss (ketosis)
  • Low protein contents <3.2% generally indicate a lack of energy
  • High protein and fat content, especially in the last third of lactation, are signs of energetic oversupply (Note, with protein > 4.0%, fat > 4.5%); pay attention to body condition!

  • Reflects well he supply of protein/nitrogen to the rumen
  • The target for the milk urea content is between 200 ppm and 250 ppm
  • Values < 200 ppm indicate protein deficiency in the rumen
  • Values > 250 ppm indicate an oversupply of protein
  • Urea value responds after feeding change within a few hours
  • Strongly fluctuating levels indicate deficiencies in the feeding pattern and mixing technique, or strongly fluctuating feed intake in the herd
  • When pasture grazing, urea values are generally higher due to the high protein content of young grasses
  • Do not exceed values of 250-300 ppm for long periods, even when pasture grazing, due to metabolic stress


Milk protein content in %     Milk urea content in ppm Conclusion/Comment
Fresh milk animals
(0-100 milking days)
Moderately lactating animals
(100-200 milking days)
Old milking animals
(200‑300 milking days)
   
<3 <3.1 <3.2 <150 Energy and protein deficiency
<3 <3.1 <3.2 > 300 Lack of energy and protein oversupply
>3 > 3.1 > 3.2 > 300 Protein oversupply
<3 <3.1 <3.2 150 - 300 Lack of energy
> 3.1 > 3.2 > 3.3 250 - 350 Slight protein oversupply
> 3.1 > 3.2 > 3.3 200 - 250 Balanced feeding

Urea report from an operating farm

Each point in the diagram represents the values for one cow.

Source: Program ITB; Company dsp agrosoft

Source: Program ITB; Company dsp agrosoft

Evaluation according to lactation stage to the diagram

Lactation stage Samples   Averages of
  number in % Mkg Fat % Protein % Urea Cell count
5th to 100th Day 58 32.2 29.6 4.02 3.14 144 147
101st to 200th Day 47 26.1 26.5 4.01 3.33 158 459
beyond 200th Day 75 41.7 17.3 4.46 3.65 154 445
Total 180 100.0 23.7 4.15 3.35 152 329
Source: Program ITB; Company dsp agrosoft

  • Significant protein deficiency of the herd in all lactation sections
  • Performance of 29.6 kg milk in the first third of the lactation weak
  • Lack of energy in animals in first third of the lactation (protein on average only 3.14%)
  • High proportion of animals with energy overload in the last third of lactation (average fat content 4.46%)
  • Low performance of <20 kg of milk per day favours obesity of the animals in the last third of the lactation

Extract of performances in the lactation thirds from an MLP:

Mean value of the cows up to 100 milking days

Group Number of animals % Milk (kg) Fat (%) Protein (%) Urine (mg/l) F:E Protein (g/MJ) ECM (kg)
1. La. 12 48 32.5 3.30 3.27 268 1.01 11.3 29.5
starting at the 2nd La 13 52 34.5 3.11 3.08 264 1.01 11.1 30.3
all 25 100 33.5 3.20 3.17 266 1.01 11.2 29.9

Mean value of the cows 101 to 200 milking days

Group Number of animals % Milk (kg) Fat (%) Protein (%) Urine (mg/l) F:E Protein (g/MJ) ECM (kg)
1. La. 1 11 21.6 3.95 3.29 267 1.20 10.5 21.3
starting at the 2nd La 8 89 26.1 3.61 3.22 255 1.12 10.8 24.2
all 9 100 25.6 3.65 3.23 256 1.13 10.8 23.9

Mean value of the cows over 200 milking days

Group Number of animals % Milk (kg) Fat (%) Protein (%) Urine (mg/l) F:E Protein (g/MJ) ECM (kg)
1. La. 6 50 23.5 3.76 3.40 270 1.11 11.0 22.6
starting at the 2nd La 6 50 24.6 3.32 3.32 244 1.00 11.5 22.5
all 12 100 24.0 3.54 3.36 257 1.05 11.2 22.6

Source: Program ITB; Company dsp agrosoft

  • Low fat levels throughout the herd
  • Protein content also very weak in all lactation sections
  • Signs of very low feed intake and related lack of energy
  • Result of the low total feed intake: acidosis
  • strong slump in milk yield on average from the first to the second lactation third of the herd = poor milk retention
  • results from metabolic disorders in fresh milking area

La. no. milking days Milk (kg) Fat (%) Protein (%) Urine (mg/l) F:E
4 233 34.8 4.00 3.67 239 1.1
2 248 27.6 4.76 3.74 222 1.3
3 261 37.9 5.51 3.97 268 1.4
2 261 25.1 4.84 3.72 268 1.3
6 262 30.9 4.91 3.36 219 1.4
4 267 30.4 4.67 3.63 260 1.3
2 268 17.4 6.30 4.32 288 1.5
1 268 25,0 4.65 3.57 233 1.3
1 268 30.8 4.85 3.70 238 1.3
2 296 12.4 5.93 4.12 282 1.4
3 316 27.2 3.79 3.35 205 1.1
7 335 30.0 4.45 3.81 197 1.2
1 340 24.7 4.99 3.93 222 1.3
2 366 21.5 5.07 4.17 226 1.2
3 380 14.5 4.74 3.78 214 1.3
5 443 16.7 4.63 3.85 224 1.2
3 478 5.9 4.64 4.07 200 1.1
3 524 20.8 5.16 4.12 179 1.3
2 583 18.8 5.05 4.13 218 1.2
1 667 24.0 4.61 4.66 193 1.0
Source: Program ITB; Company dsp agrosoft

  • Old milking animals in the last third of lactation
  • Conspicuous: very high fat and protein contents = obesity!
  • Check BCS especially in low performance animals!
  • Animals that are too fat should be put dry
  • if necessary, premature drying (BCS <= 3.75)


Reasons for thin droppings Reasons for solid droppings

  • Too much concentrated feed
  • Starch surplus (feeding with concentrates too fast)
  • Protein surplus (high proportion of grass silage, young pasture grass, too much protein concentrate)
  • Too little structure in the diet (e.g. wet silage)
  • Structure destroyed from mixing too long (mixing cart)
  • Abrupt feed changes
  • Heavily soiled or mouldy feed
  • Over-supply of minerals
  • Infections/diseases
  • Poor quality drinking water


  • Excessive, raw fibre-rich food
  • Proportion of straw to high (e.g. dry cows)
  • Protein deficiency in the diet
  • Lack of energy in the ration
  • Poor water supply
  • Fever, illness
  • Ketosis (acetonemia)


Colour of excrement Smell of excrement
  • yellow:
    • structural deficiencies
  • dark green:
    • fresh/young pasture
  • light brown:
    • high starch
  • dark brown + glossy colour:
    • slow pass rate
  • pleasant
  • piercing due to:
    • putrefaction
    • excessive starch fermentation in the colon

Not only the consistency, but also the undigested food particles allow conclusions to be drawn about digestion, especially in the rumen

High proportion of undigested grains in the droppings (cereals, maize):

  • Check maize silage and whole grain/crushed grain! Grains in maize silage should not only be chipped but also chopped
  • Too little quickly available carbohydrates in the rumen; fresh maize silage has a high proportion of resistant starch
  • Passage rate too fast (too much cereal)


Reasons for high percentage of fibres in the excrement:

  • Lack of energy (starch and sugar) or lack of protein in the rumen; Microbes have too little energy or protein for recovery and synthesis
  • No balanced relationship between available energy, protein and structure in the rumen

Source photo: Production technical consulting LK NRW

Source photo: Production technical consulting LK NRW

Execution:

  • Place a handful of excrement (about 100 ml) in a colander (mesh size 1.5 mm) and rinse with plenty of water until only undigested, coarser material is in the sieve
  • Account for whole maize grains and grain fragments and check if there is still starch in the debris or if it is just the grain husk
  • Check fibre components in the sieve. All components should be <0.5 cm. What is the proportion of longer fibres (> 1 cm)?
  • Evaluation of the excrement should be made based on around 5% of the herd
  • When animals are in performance groups, it makes sense to judge the excrement of each group, if different rations are fed

Assessment of losses via the excrement:

  • 1 hand full of excrement = 100 ml corresponds to a daily excrement amount of 40 - 50 kg per cow about 1/400 of the total excrement
  • With 1 grain per 100 ml, this corresponds to 400 grains per day, which are excreted undigested
  • A single maize grain in the silage weighs about 0.3 g, so that with an excretion of 400 grains per day, a starch loss of 120 g can be calculated

Undigested grains in the excrement (per 100 ml) Loss of strength per day
1 120 g
3 360 g
5 600 g
7 840 g
9 1080 g

Causes for grains in the excrement:

  • Whole grains in the excrement are a sign of errors in the harvesting technique (e.g. rollers)
  • Rumen acidosis; usually in combination with thin droppings; passage rate too fast; disturbed microflora and reduced digestion
  • Nitrogen/protein deficiency in the rumen; in relation to starch, protein is lacking and rumen digestion is reduced
  • Lack of minerals (sodium, phosphor) important for microorganisms leads to poorer digestion


Causes of long fibres (> 1 cm) in the excrement:

  • Lack of rapidly fermentable carbohydrates in the rumen
  • Lack of protein in the rumen
    • Firm, fibrous excrement
  • Too many quickly fermentable carbohydrates
  • Protein surplus
    • Thin, fibrous excrement
  • No synchronicity of nutrients in the rumen

Feeding guide (cows)

  • Illustrated depiction of a cow, area highlighted here: Ration

    Area: Ration

  • Illustrated depiction of a cow, area highlighted here: Mouth and esophagus

    Area: Mouth and esophagus

  • Illustrated depiction of a cow, area highlighted here: Rumen and reticulum

    Area: Rumen and reticulum

  • Illustrated depiction of a cow, area highlighted here: Leaves and abomasum

    Area: Leaves and abomasum

  • Illustrated depiction of a cow, area highlighted here: small intestine

    Area: small intestine

  • Illustrated depiction of a cow, area highlighted here: Colon

    Area: Colon

  • Illustrated depiction of a cow, area highlighted here: Milk

    Area: Milk

  • Illustrated depiction of a cow, area highlighted here: Dung

    Area: Dung